Example 1: Break Even Analysis at Great Threads


Background
The Great Threads Company sells hand-knit sweaters. A spreadsheet model was developed to help the company implement a plan to print a product catalog and a direct mail campaign. It will cost $20,000 plus $0.10 per catalog to print the catalog and $0.15 to mail each catalog. In addition, it will cost $0.20 extra for each direct mail envelope used by a respondent. The average size of a customer order is $40 with the company’s variable cost per order averaging about 80% of the order’s value. Great Thread wants to mail 100,000 catalogs.


Objective
Great Threads wants to develop a spreadsheet model to answer the following questions:

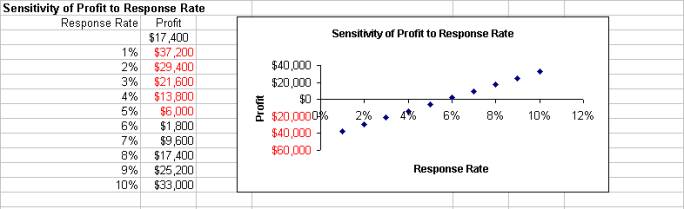
1.       How does a change in the response rate affect profit?

2.       For what response rate does the company break even?

3.       If the company estimates a response rate of 3%, should it proceed with the mailing?

4.       How does the presence of uncertainty affect the usefulness of the model?


Decision & External Variables
Great Threads will use the results of the spreadsheet analysis to decide to proceed with the direct mail campaign. The decision variable is profit. The external variables are the direct mail envelope costs, the number of responses, and the average size of a customer order.


Spreadsheet Model
 The model was created via the following steps:

1.       Headings, 
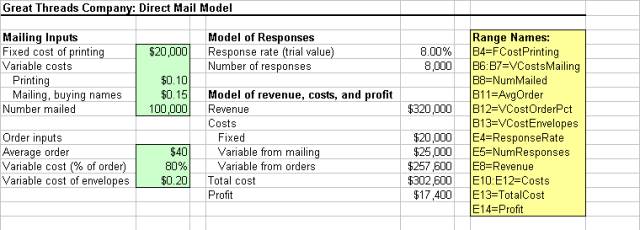
range names and input values were entered for the given data

2.       A model of the responses was created using a reasonable value of 8% in the ResponseRate cell using the formula = NumMailed*ResponseRate.

3.       A model of the revenue, costs and profits created in the Revenue cell using the formula = NumResponses*AvgOrder.

4.       The formulas =FCostPrinting, =SUM(VCostsMailing)*NumMailed and =NumResponses*(AvgOrder*VcostOrderPct+VcostEnvelopes) were entered into the Costs cells (E10, E11, and E12)

5.       The formula =SUM(Costs) was entered in the TotalCost cell.

6.       The formula =Revenue-TotalCost was entered in the Profit cell.

To access the spreadsheet model, click here


Analyses

Question 1 – To show how profit varies with the response rate, a data table was formed by entering a sequence of trial values of the response rate in column A, and enter a “link” to profit in cell B20 with the formula =Profit. After highlighting the table range, the Data/Table menu item was selected and filled in to show the input, ReponseRate. After OK was selected, Excel substituted each response rate value in the table into the ResponseRate cell, recalculated profit and reported it back to the table. The associated scatterplot shows the relationship between the values in the data table. The results show a linear relationship between profit and the response rate. More specifically, a 1% increase in the response rate always increases profit by $7,800. This is because each 1% increase in the response rate results in 1,000 additional orders. Each order generates an average revenue of $40, a variable cost of $32 and an envelope cost of $0.20. Therefore, the net gain in profit is $7.80 per order or $7,800 for 1,000 orders.

Question 2 – To find the exact breakeven point, the Goal Seek tool in Excel can help solve a single equation in a single unknown. In the case of Great Threads, the equation is Profit=0 and the single unknown is the response rate. Goal Seek generated a ResponseRate value of 5.77% and a Profit value of $0. As a result, if the response rate is 5.77%, the company breaks even. If the response rate is greater than 5.77%, the company makes money.

Question 3 – Although results from the data table point to a loss (negative profit) when the response rate is only 3%, a long-term view may find this rate acceptable. The fact that many of the customers who respond to direct mail will reorder in the future should be taken into consideration. Since the company makes $7.80 per order, profit would be positive if each respondent orders two more times. As a result, the company could earn $46,800 or (3000($7.80)(2)) which is more that the model shows.

Question 4 – Uncertainty is a factor in this model because model inputs are known with certainty. However, the degree of uncertainty is what is significant. In the case of Great Threads, the average size of a customer order is known although it may vary. Therefore, it is more accurate to state the probability that Great Threads will break even or their profit will have a certain value.


Recommendations
Based on the results of this model, Great Threads should proceed with the direct mail campaign, even if the response rate is only 3%. If they want to take a more cautious short-term view, they should aim for a minimum response rate of 5.77%.